Investigating Redo-Redo and Undo
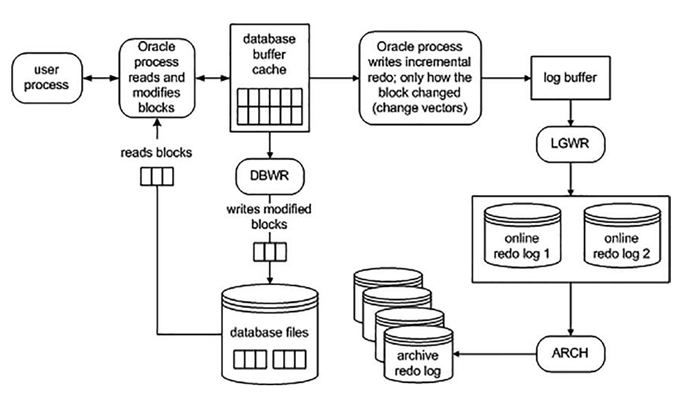
As part of processing transactions, Oracle captures how the data is modified (redo) and writes that information to the log buffer memory area. Next, the log writer background process will frequently write the redo information to disk (online redo logs). If you have archiving enabled in your database, as soon as an online redo log is filled up, the archiver process will copy the online redo log to an archived redo log. The architecture of processing transactions and the subsequent redo stream is displayed in Figure 9-5.

Figure 9-5. Oracle transacting data and writing redo
Redo management can be a point of serialization (bottleneck) within the database. This is because eventually all transactions end up at LGWR (or one of its worker processes) asking it to manage their redo and COMMIT their transaction. The amount of redo generated also influences how much work the archiver process has to process. If you have a standby database, this redo has to also be transferred and applied to the standby. The more log writer and the archiver have to do, the slower the system will be.
Therefore, as a developer, it’s important to be able to measure how much redo your operations generate. The more redo you generate, the longer your operations may take, and the slower the entire system might be. You are not just affecting your session, but every session. By seeing how much redo an operation tends to generate, and testing more than one approach to a problem, you can find the best way to do things.
Note Oracle will always start at least one LGWR background process. On multiprocessor systems, Oracle will spawn additional log writer worker processes (LG00) to help improve performance of writing redo to disk.
Measuring Redo
In this first example, we’ll use AUTOTRACE to observe the amount of redo generated. In subsequent examples, we’ll use the GET_STAT_VAL function (introduced earlier in this chapter).
Note You will not see the exact same results when you run these examples in your environment. Your results may vary depending on variables such as the number of records in BIG_TABLE, memory configuration, CPUs, and other processes running on your system.
Let’s take a look at the difference in redo generated by conventional path INSERTs (the normal INSERTs you and I do every day) and direct path INSERTs—used when loading large amounts of data into the database. We’ll use AUTOTRACE and the previously created tables T and BIG_TABLE for this simple example. First, we’ll load the table using a conventional path INSERT:
$ sqlplus eoda/foo@PDB1
SQL> set autotrace traceonly statistics;
SQL> truncate table t;Table truncated.
SQL> insert into t select * from big_table; 1000000 rows created.
As you can see, that INSERT generated about 113MB of redo.
Note The example in this section was performed on a NOARCHIVELOG mode database. If you are in ARCHIVELOG mode, the table would have to be created or set as NOLOGGING to observe this dramatic change. We will investigate the NOLOGGING attribute in more detail shortly in the section “Setting NOLOGGING in SQL.” Please make sure to coordinate all nonlogged operations with your DBA on a “real” system.
When we use a direct path load in a NOARCHIVELOG mode database, we get the following results:
SQL> truncate table t;Table truncated.
SQL> insert /*+ APPEND */ into t select * from big_table; 1000000 rows created.
That INSERT generated only about 220KB—kilobytes, not megabytes—of redo. As you can see, the amount of redo generated by a direct path insert is much less than a conventional insert.
